Introduction: This paper predicts large-scale defects in LPBF materials and explores solutions. This article is the second part.
3.2. μSXCT verification of pore boundaries of small pores in Ti-6Al-4V
For Ti-6Al-4, power densities greater than 106 W/cm2 at the metal surface may cause the molten pool geometry to transition from a semicircular “conduction mode” to a deep and narrow “pinhole mode” V. The appearance of keyhole mode is usually determined by the ratio of the depth to width (D/W) of the molten pool (aspect ratio of the molten pool cross-section) greater than 0.5. However, high-speed visualization of synchrotron X-rays revealed a well-defined threshold for the power density of pinhole formation. In keyhole mode, large spherical keyhole defects can occur due to operation in the high-power, low-speed region of the process space (Figure 1). The formation of these defects is largely dependent on the choice of laser spot size and the boiling point of the particular material. In pinhole mode, the absorptivity (ie, net energy absorption) increases to a much larger value than in conduction mode, due to multiple reflections of the beam in the vapor cavity formed where the laser intersects the molten pool. This enables the laser to “drill” to greater depths in the material, creating an elongated melt pool and a pronounced vapor cavity in the center of the cross-sectional melt pool.
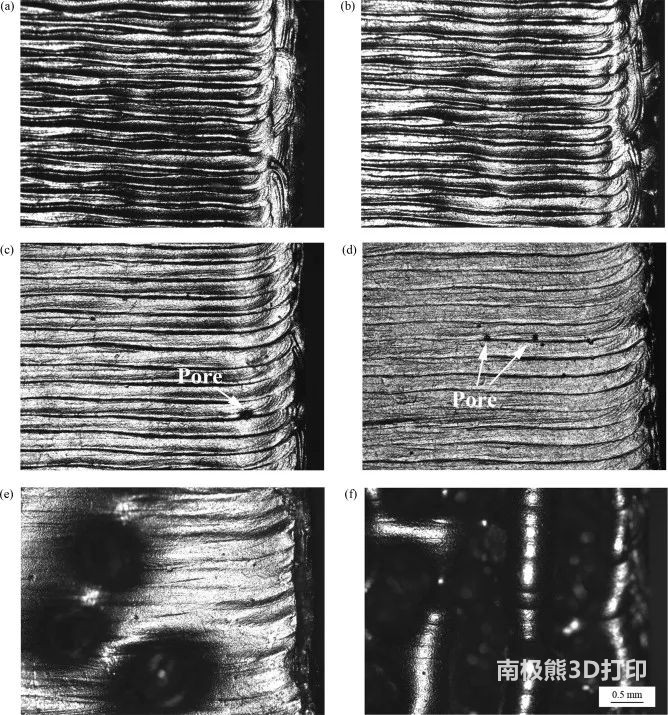
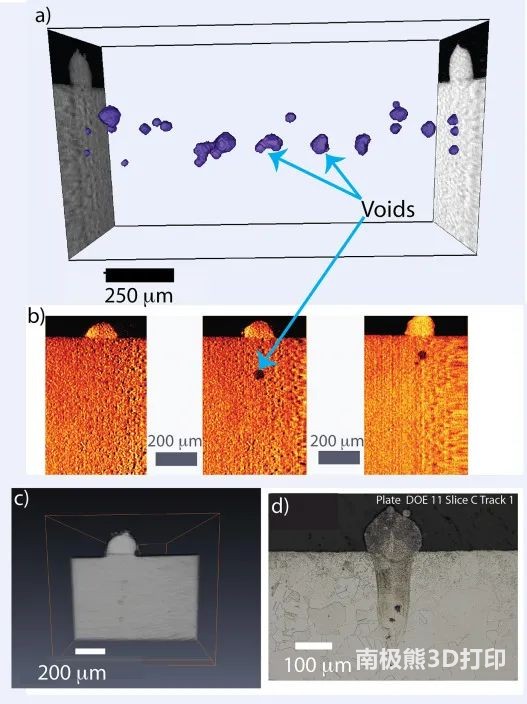
The upper figure shows the results of the SRμT investigation of the sample on the orbit with parameters of 137 W laser power, 188 mm/s scan speed and D4σ = 52 μm. Since pinhole mode laser melting was observed in metallographic studies, this sample was selected for tomography, as shown in Figure d. Figure a is the 3D distribution of the purple holes, and Figure b is the 2D tomogram of three sections at different positions in the sample along the laser trajectory. Each section in Figure b has a different distribution of holes. Panel c is a 3D rendering of the sample surface. Incomplete collapse of the vapor cavity leaves a void in the wake of the laser beam, as shown in Fig. X-ray tomography has previously been used to characterize 3D porosity in stainless steel welds (Madison and Aagesen, 2012). The 3D morphology of voids was observed for the anisotropy of the samples, and it was also found that the main contribution of total porosity in the samples was due to some of the voids with the largest void volume.
Recent studies have shown that the appearance of pinhole porosity in metallic AM is due to the instability of the bottom of vapor depressions (i.e. pinholes), which are left behind when the laser leaves the molten pool. This instability is directly related to the high aspect ratio that occurs in the cavity in the upper left corner of PV space, that is, for a given spot size, high power and low velocity. Therefore, by quantifying the defect content in the entire PV space, the pinhole porosity boundary V of LPBF Ti-6Al-4 can be estimated across the process space. The combination of high power and low velocity results in morphological instability in the deep small-pore melt pool and subsequent porosity in the in situ dynamic x-ray (DXR) single-bead sample. Furthermore, even in unstable keyhole melt pools, the extent or incidence of porosity is not constant. Therefore, accurate, real-time pinhole morphology data has great potential as a useful predictor of pinhole porosity in the process space.
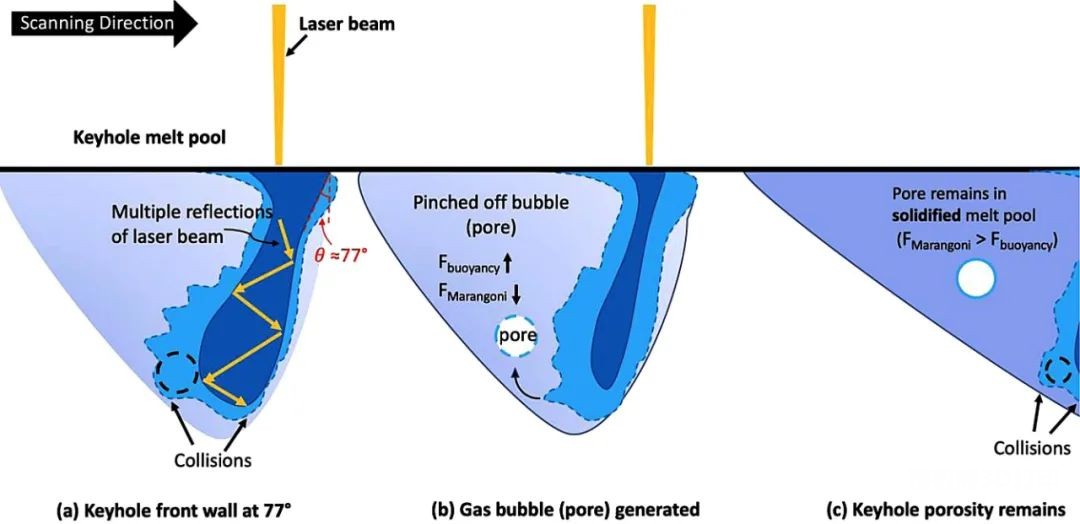
The elongation of the melt pool in the depth direction is indeed a key determinant of the small hole melt pool. As mentioned earlier, some degree of keyhole is necessary to create keyhole wall fluctuations that squeeze air bubbles (holes) into the molten pool. Figure 3 shows a schematic diagram of the transfer of pinhole porosity to the molten pool through front wall fluctuations. It is worth noting that in laser welding, the pinhole wall fluctuations that cause pores are related to the pinhole front wall angle (θ). Cunningham et al. found that when the value of θ is greater than 77°, large-scale small pores V are formed in LPBF Ti-6Al-4.
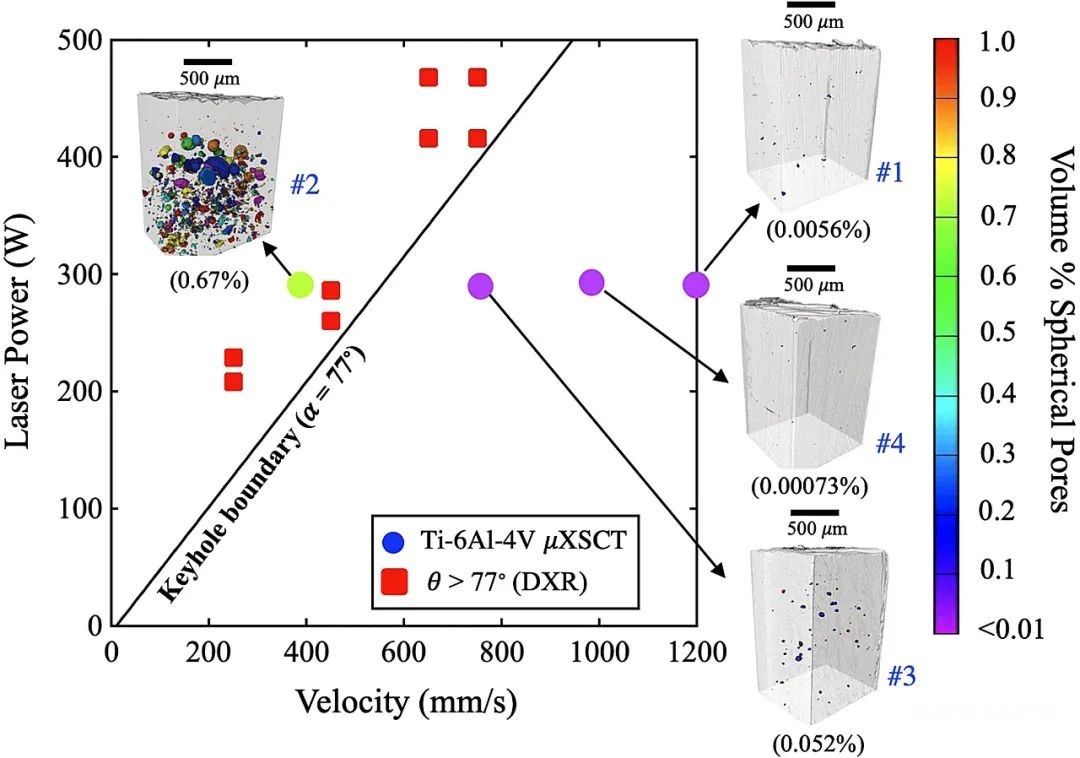
In order to analyze the keyhole severity leading to the keyhole porosity of the Ti-6Al-4V test block, in this study, the molten pool depth and morphological data of the medium Ti-6Al-4V DXR single-track experiment were plotted according to the Ti-6Al-4V test block . Figure 4 shows the Ti-6Al-4 V block printed in the high-power, low-speed region of the PV space according to the DXR Ti-6Al-4V molten pool morphology, θ>77°in. It can be easily observed that the sample 2 of the Ti-6Al-4V coupon is in the small-pore porosity range (θ>77°). This results in large-scale pinhole defects with spherical (pinhole) porosity values of approximately 0.67%. However, samples 1 and 4 have θ<77° and minimum spherical porosity, and sample 3 has a minimum porosity of about 0.00073% (Fig. 4). Compared to sample 2, this value is negligible, which is consistent with the large-scale small-pore porosity that occurs when θ > 77°. However, even though the front wall angle θ of Sample 3 was < 77°, it also contained spherical pinhole porosity (0.052%). This suggests that this approach may need to be revisited. More research suggests, but the current work confirms the DXR trend described in .
For ti-6al-4v test blocks outside the aperture boundary (θ < 77°), the following instructions can be made. The keyhole front wall angle is a function of laser speed (Vw) and power density dependent drilling speed (Vd), namely:

NOTE: Vd is the component of the laser velocity acting perpendicular to the surface, i.e. the velocity that causes the laser beam to penetrate the material. Therefore, as the laser speed increases, the pinhole front wall angle decreases, and thus the pinhole porosity decreases for a constant Vd. ROP was calculated from the time-resolved vapor deposition penetration depth in a fixed in-situ DXR experiment using the same PV combination as the test block fabrication. Figure 4 shows this, there is a significant difference in defect density between samples 3 and 4. Sample 3 showed clearly small, round defects, while samples 4 (P = 280 W) and 6 W (P = 370 W) showed acceptable results due to the 200 mm/s increase in laser speed in both cases. Negligible porosity. Although the defects observed in sample 3 were inferred to be small pore porosity, it is also possible that these μSXCT scan volumes contained some spherical pores in the powder. Therefore, it is necessary to further analyze and characterize the differences between gas and pinhole porosity on these samples.
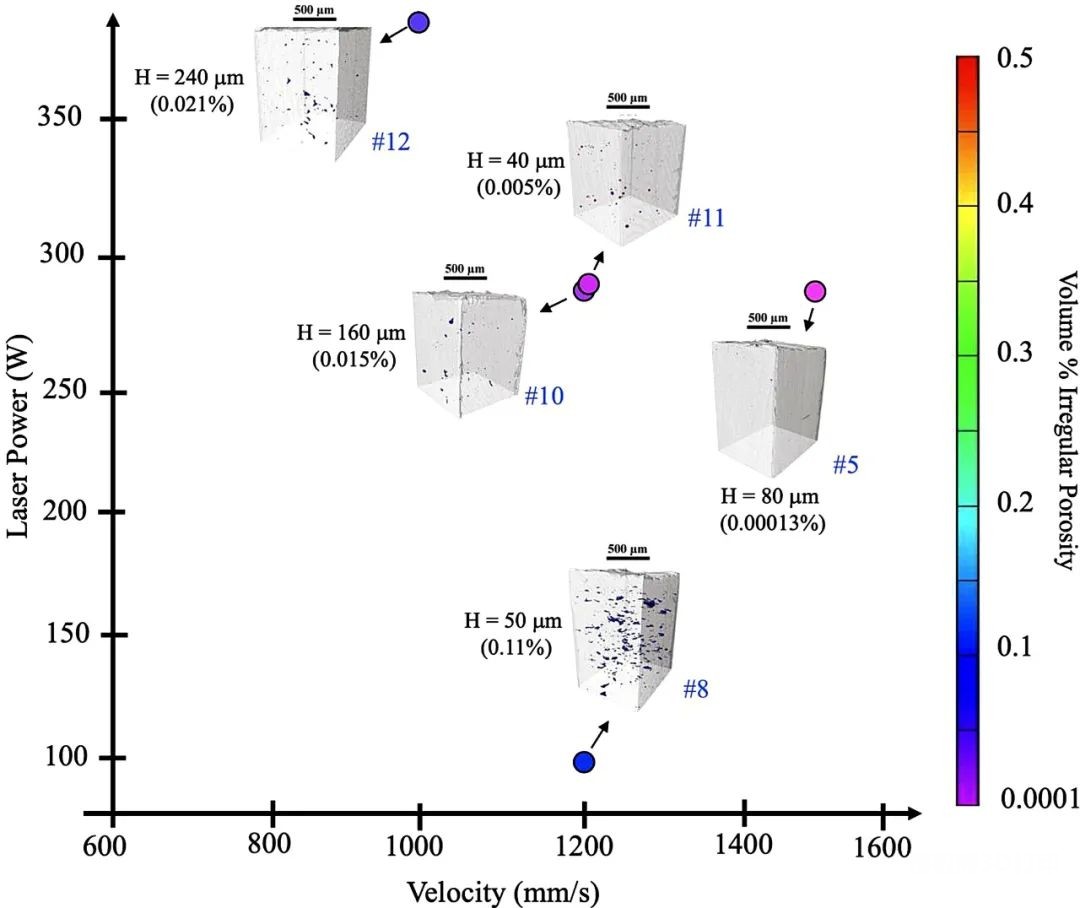
Figure 5 shows the defect density in samples with different packing spacings. In the case of samples 10 and 11, for the same power and speed combination, the percentage of spherical holes increases as the pattern fill pitch decreases. Although Sample 10 was designed to result in a lack of fusion pores, the percentage of lack of fusion pores was lower. Both observations suggest that: (i) dense trajectories lead to elevated temperatures, which increase the susceptibility to pinhole formation, leading to spherical pores even under non-pinhole parameter combinations; (ii) hemispherical melt pools Shape assumptions fail in certain areas of the process space, which in turn changes the process window due to lack of fusion porosity.
Similarly, in the case of sample 8, the parameters were not designed for the lack of molten porosity, but the sample consisted of the lack of molten porosity, which also suggests that the hemispherical molten pool shape must be used with caution when using geometric models that lack molten porosity hypothesis of. Samples 5 and 12 were designed to maximize deposition rates when using different combinations of power, speed and hatch spacing. In sample 5, the velocity was increased to produce a higher deposition rate and the hatch spacing was reduced to 80 μm to account for the smaller molten pool size. Whereas in sample 12, the fill pitch was increased to 240 μm, increasing the power to 370, resulting in a higher deposition rate W which would result in a larger melt pool. Interestingly, few fusion pores were observed in sample 12, while sample 5 did not show any apparent spherical or irregular pores. This observation also highlights the importance of weld pool geometry and variability, especially when using larger hatch spacings such as 240 μm, ie 100 μm higher than the nominal hatch spacing. Overall, the optimal hatch spacing that allows for adequate remelting, while not causing a temperature increase, can reduce the overall porosity observed in Sample 5.
Finally, it should be noted that the difference in sample 10 and sample 12 is because they correspond to H/W values close to 1. Therefore, the inaccuracy of the assumed melt pool shape and the variability of the actual melt pool size and shape are most pronounced when the predicted melt bead overlap is small or non-existent. For sample 8, melt pool variability was not a significant factor, but the assumed melt pool shape may be the only issue. This is because the predicted melt pool width is similar to the laser spot size, while the hemispherical melt pool is only suitable for point heat sources.
3.3. Automated ML characterization method for gas porosity in AM powders
Considering that a portion of the porosity contained in the raw powder is transferred into the printed metal, it would be useful to develop a characterization method that relates pore size to particle size. Metal LPBF AM powders are manufactured in a variety of ways, three of the most common are gas atomization, plasma atomization (PA), and rotating plasma electrode (PREP) techniques. For PA, multiple plasmas are accelerated by atomizing an inert (argon) gas, and wire melting and atomization occur in a single step. The preparation process also operates in an inert environment, using a rotating anode, which is melted by an electric arc, forming droplets that are further atomized and solidified into spherical particles. However, during metal AM processing, inert gas within individual powder particles can lead to unusual laser powder defects, where the transfer of gas porosity to fabricated AM parts depends on processing parameters and melt pool dynamics. therefore,
EOS
Individual powder particles and trapped pores in the plasma atomize and produce Ti-6Al-4 V powders were investigated to quantify whether high-porosity powders also lead to high-porosity parts in metal AM LPBF builds (Fig. 4). In particular, individual pores were investigated in detail as a function of powder particle size, as it is useful to know whether pore size is proportional to powder particle size. For example, electron beam powder beds use coarser powders, which may mean that we expect larger pores.
Figure 5 compares pore size and closed particle size in PA and PREP powders using ML segmentation and analysis techniques. Section 2.3 above describes the segmentation procedure used in this analysis. Note that the lower limit of size is determined by the resolution of the CT reconstruction; here a minimum pore volume of nine voxels was used, where a voxel size of 0.65 μm3 corresponds to a minimum pore size of 0.87 μm. Figure 6a shows the log-scale correlation plot, This graph relates the powder particle size (radius) to the particle size distribution of the pores contained within the pore particles of each Ti-6Al-4 V. powder sample. A logarithmic scale plot is used in Figure 6a to enhance the visualization of clustering behavior. Figure 6b shows the same pore size (radius) data as in Figure 6a, but shown in a histogram with a bin size of approximately 4 μm; the number and frequency of porosity for each powder is expressed as the fraction of particles with pores. NOTE: The two powders in Figure 5b were compared using the “fraction of particles with holes” because more PA powder particles (~5000) were measured than prepared particles (~3100). This is because of the average particle size of PREP The diameter is larger than the average particle size of PA, resulting in more PA particles per CT volume.
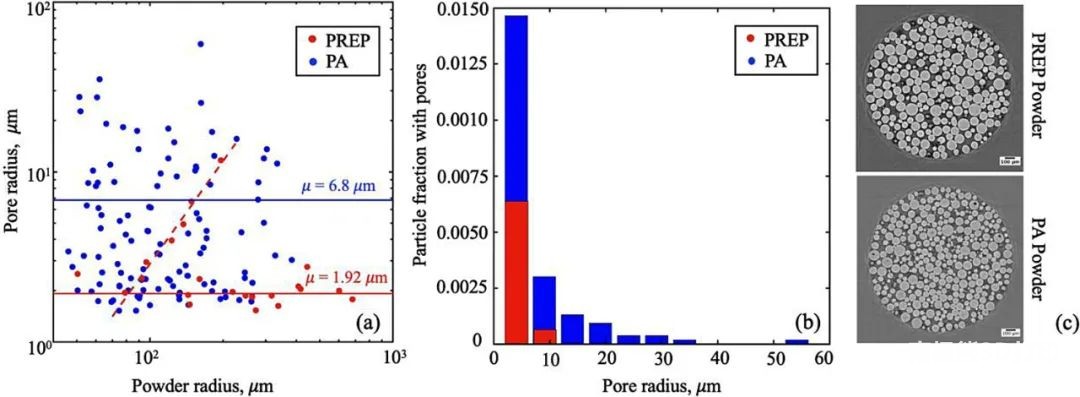
The pore sizes of the PREP and PA powders in Figures 6a and 6b were determined assuming spherical geometry, such as V = 4/3πR3, where R is the radius. Overall, the average pore size of PREP powders is larger than that of PA powders. As shown in Fig. 6b, the number of both small and macropores in the prepared powders is much less than that of the PA powders. For any PA Ti-6Al-4 V powder radius, the pore size distribution is wide, spanning about 10 times. This means that, for this fabrication technique, there is no strong correlation between powder radius (e.g. size) and pore size, contrary to the intuitive expectation that pore size may increase with particle size.These results are related to[49]The results reported in single pore size and powder size are consistent. Close inspection of the prepared powders in Fig. 6a (red dots) revealed a strange feature of two branches, where a fraction of the particles appeared to have pore sizes proportional to particle size, while the rest had very small pore sizes (Fig. 6a). The source of the apparent different distributions in the prepared powder is unclear; however, the regression fit to this data is of the form Rpore=C∙Rparticleα, where α=2.01 and C=2.77E-04 (Fig. 6a). In contrast, PA and PREP powders have similar trends in anisotropy values (i.e., sphericity), making it difficult to draw strong conclusions about morphological differences between the two powder types.
3.4. Ti-6Al-4 gas porosity transport analysis V test block
Although dominant LOF and pinhole porosity can be avoided by proper choice of LPBF process parameters, gas porosity may still exist within the process window for fully dense parts (Figure 1). As previously mentioned, gas porosity is due to the fact that typical starting powder feedstocks made by gas or plasma atomization may contain large amounts of entrapped gas within a single powder particle. When laser melting, this can cause bubbles to transfer to the molten pool during laser melting. Figure 7 directly shows the transfer of pores to the molten pool during laser-powder interaction captured by an ultrafast DXR scan of Ti-6Al-4 V using a stationary laser, i.e., spot welding. In Figure 7 (top right), powder particles containing air bubbles (red circles) are located near the laser beam and are pulled into the molten pool (b


0 Comments for “Process flow chart of laser powder bed fusion additive manufacturing defect structure (2)”