“In most laboratory environments, equipment such as signal generators and spectrum analyzers are single-ended instruments used to measure the distortion of high-speed differential amplifier drivers and converters. Therefore, measuring the even-order distortion of the amplifier driver (such as second-order harmonic distortion HD2, or even-order even-order intermodulation distortion or IMD2) requires additional components, such as baluns and attenuators, as part of the overall test setup to integrate The single-ended test instrument is connected to the differential input and output of the amplifier driver.
“
Authors: David Brandon and Rob Reeder
Summary
In most laboratory environments, equipment such as signal generators and spectrum analyzers are single-ended instruments used to measure the distortion of high-speed differential amplifier drivers and converters. Therefore, measuring the even-order distortion of the amplifier driver (such as second-order harmonic distortion HD2, or even-order even-order intermodulation distortion or IMD2) requires additional components, such as baluns and attenuators, as part of the overall test setup to integrate The single-ended test instrument is connected to the differential input and output of the amplifier driver. This article reveals the importance of phase imbalance through the mathematical knowledge of mismatched signals, and explains how phase imbalance can lead to an increase in even-order products (that is, worse!). This article will also show how the trade-offs of several different high-performance baluns and attenuators affect the performance indicators of the amplifier under test (ie, HD2 and IMD2).
Mathematical background = yeah!
When testing high-speed devices with differential inputs (such as analog-to-digital converters, amplifiers, mixers, baluns, etc.), amplitude and phase imbalance are important indicators that need to be understood.
When the analog signal chain is designed to use frequencies of 500 MHz and above, you must be very careful, because all devices (whether active or passive) have some inherent imbalance in the frequency range. 500 MHz is not a fantastic frequency point, but based on experience, this is where most devices start to deviate from phase balance. Depending on the device, this frequency may be much lower or much higher than this.
Let’s take a closer look at the following simple mathematical model:
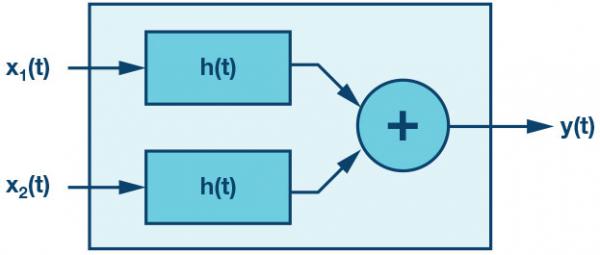
Figure 1. Mathematical model with two signal inputs.
Consider the input x

If this is not the case, due to the imbalance of these devices, the even-order distortion test results of the ADC may change significantly within the operating frequency range.
ADC or any active device can be simply modeled as a symmetric third-order transfer function:

So:
Ideally, there is no imbalance. The transfer function of the above simple system can be modeled as follows:
When x1

![]()
Applying trigonometric identities to powers and collecting information such as frequency, we get:

This is a common result of differential circuits: the even harmonics of the ideal signal are cancelled, while the odd harmonics are not cancelled.
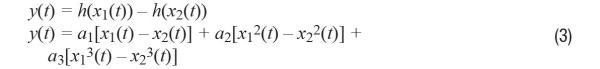
Now suppose that the amplitudes of the two input signals are unbalanced, but there is no phase imbalance. In this case, k1 ≠ k2, and φ = 0.

Substitute formula 7 into formula 3 and apply the trigonometric identities of powers again.
We see that in Equation 8, the second harmonic is proportional to the difference between the squares of the amplitudes k1 and k2, in simple terms:

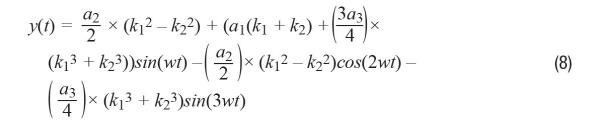
Now, suppose that the two input signals are unbalanced in phase and there is no amplitude imbalance. Then, k1 = k2, and φ ≠ 0.

Substitute formula 10 into formula 3 and simplify it-try it, you can do it!
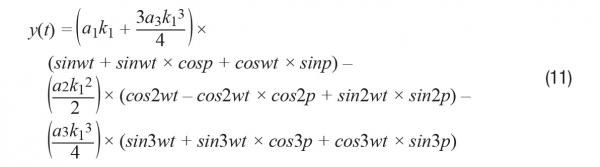
It can be seen from formula 11 that the amplitude of the second harmonic is proportional to the square of the amplitude k.

If we go back and compare Equation 9 and Equation 12 and assume that the trigonometric identities are applied correctly, we can conclude that the second harmonic is more severely affected by phase imbalance than amplitude imbalance. The reasons are as follows: for phase imbalance, the second harmonic is proportional to the square of k1; see Equation 12, for amplitude imbalance, the second harmonic is proportional to the square difference of k1 and k2, or see Equation 9. Since k1 and k2 are roughly equal, this difference is usually small, especially if you compare it to a squared number!
Testing high-speed amplifiers
Now that we have cleared the obstacles, let’s look at a use case, as shown in Figure 2. This is a block diagram showing the HD2 distortion test setup commonly used in differential amplifier experiments.
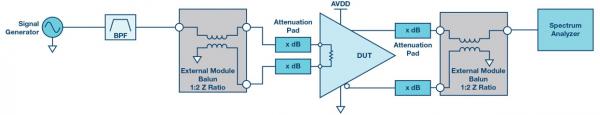
Figure 2. High-speed amplifier HD2 test setup
3. It looks quite simple at first glance, but the devil is hidden in the details. Figure 3 shows a set of HD2 test results, which are obtained using all the components, differential amplifiers, baluns, attenuators, etc. in this block diagram. These tests proved that only the slight phase mismatch caused by reversing the balun direction in different ways can produce different results in the HD2 sweep. There are two baluns in this setup, so four possible scenarios can be created by reversing the connections on one or both sides. The result is shown in Figure 3.
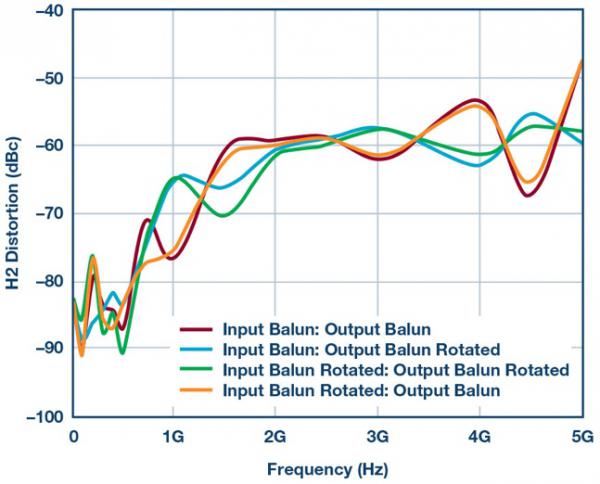
Figure 3. Use the supplier 1A balun and different balun directions to test HD2 performance.
The variance of the HD2 distortion curve revealed in Figure 3 proves that the performance of the balun needs to be further investigated, especially the phase and amplitude imbalance. The following two pictures show the phase and amplitude imbalance of several baluns from different manufacturers. Use a network analyzer to measure the imbalance.
The red curves in Figures 4 and 5 correspond to the actual baluns used in Figure 3 to collect HD2 distortion data. This balun from supplier 1A has the highest bandwidth and good passband flatness, but on the same 10 GHz frequency test band, the phase imbalance is worse than other baluns.
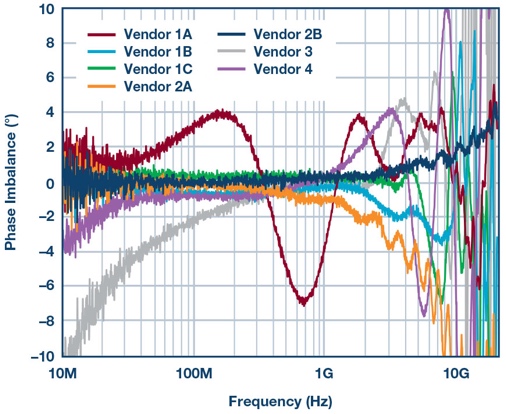
Figure 4. Phase imbalance of various baluns
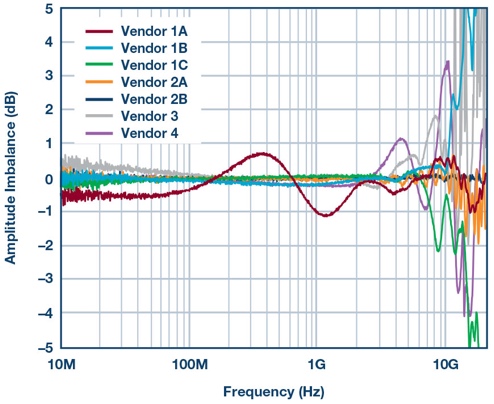
Figure 5. Amplitude imbalance of various baluns
The next two graphs represent the results of the HD2 distortion retest using the best baluns. These baluns are from supplier 1B and supplier 2B, and have the lowest phase imbalance, as shown in Figure 6 and Figure 7. Note that if there is better imbalance performance, the HD2 distortion variance will be reduced accordingly, as shown in Figure 7.
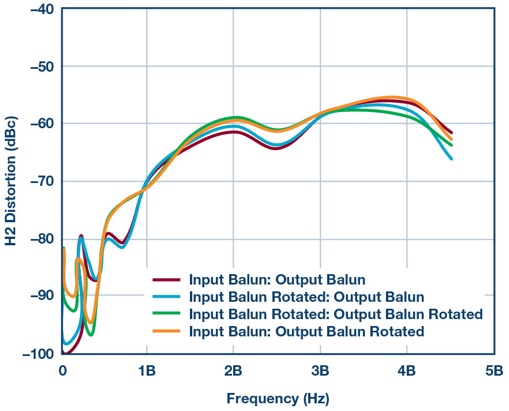
Figure 6. Re-test HD2 performance using supplier 1B balun and different balun directions.
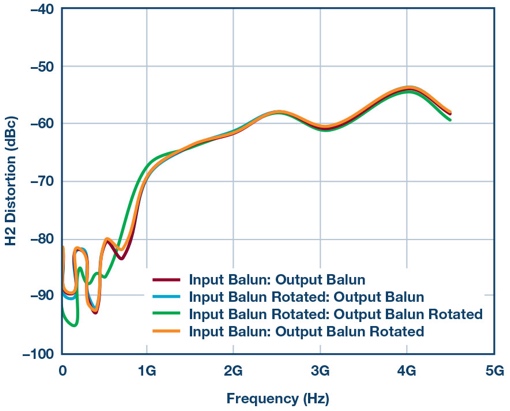
Figure 7. Re-test HD2 performance using supplier 2B balun and different balun directions.
To further illustrate how the phase imbalance directly affects the even-order distortion performance, Figure 8 shows the HD3 distortion under the same conditions as the previous HD2 diagram. Please note that all four curves are roughly the same and are in line with expectations. Therefore, as demonstrated by the previous mathematical derivation example, HD3 distortion is less sensitive to imbalances in the signal chain.
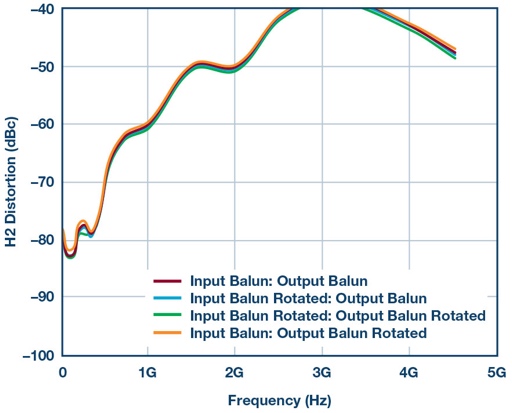
Figure 8. Use supplier 2B balun and different balun directions to test HD3 performance.
So far, it should be assumed that the attenuator pads connected to the input and output (as shown in Figure 2) are fixed and consistent, and there is no change during the balun direction measurement. The same curve shown in Figure 7 below, only tests the performance of supplier 2B’s balun, and exchanges the attenuator between input and output. This produces another set of (four) curves, as shown by the dashed line in Figure 9. The result is that we are back to where we started, because this shows more changes in the test and measurement. This further emphasizes that a small amount of mismatch on either side of the differential signal has a great impact at high frequencies. Be sure to record the test conditions in detail.
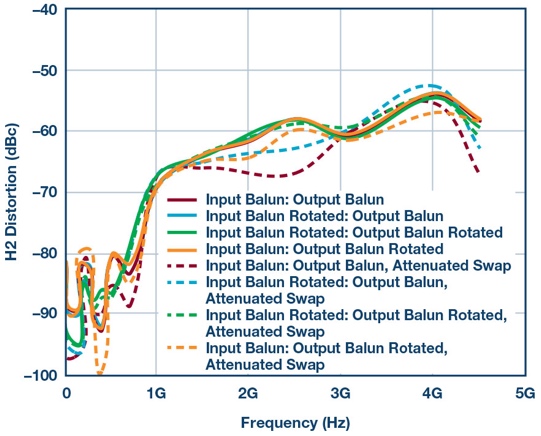
Figure 9. Use only supplier 2B baluns and different balun orientations and attenuation pad exchanges to test HD2 performance.
Offset all
In short, when developing a fully differential signal chain in the GHz region, everything is important, including attenuator pads, baluns, cables, traces on printed circuit boards, etc. We have proven this in mathematics and in the laboratory using high-speed differential amplifiers as test platforms. Therefore, before starting to blame the device or the supplier, please be especially careful during PCB layout and laboratory testing.
Finally, you may ask yourself, how much aspect imbalance can be tolerated? For example, if a balun has a phase imbalance of x degrees at x GHz, how does it affect a specific device or system? Will there be a certain degree of loss in linearity performance or how much dB is degraded?
This is a difficult question to answer. In an ideal world, if everything in the signal chain is perfectly matched, then there will be no even-order distortion to worry about. Secondly, if there is a rule of thumb or formula to tell us that every x° of phase imbalance will bring about x dB of linearity loss (HD2 performance degradation), it would not be beautiful. However, this is impossible. Why? Because every device, whether active, passive or differential, has some inherent phase mismatch. There is no way to achieve a perfect balance of IC design internally, or to cut cables of absolutely the same length. Therefore, no matter how small these mismatches are, they will become more prominent as the system is used more and more frequently.
In short, When using fully differential input and output, we will do our best to do our job well to keep the IC layout mismatch to a minimum. When you test our products in the laboratory, I hope you do the same.
David Brandon [[email protected]
0 Comments for “High-speed amplifier testing requires enough mathematical knowledge to use the balun correctly”